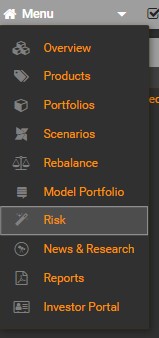
This tab offers four parts: Summary, Attribution, Risk-Return and Correlation.
After you select your target
portfolio/model portfolio, you can assess the risk in your selected portfolio.
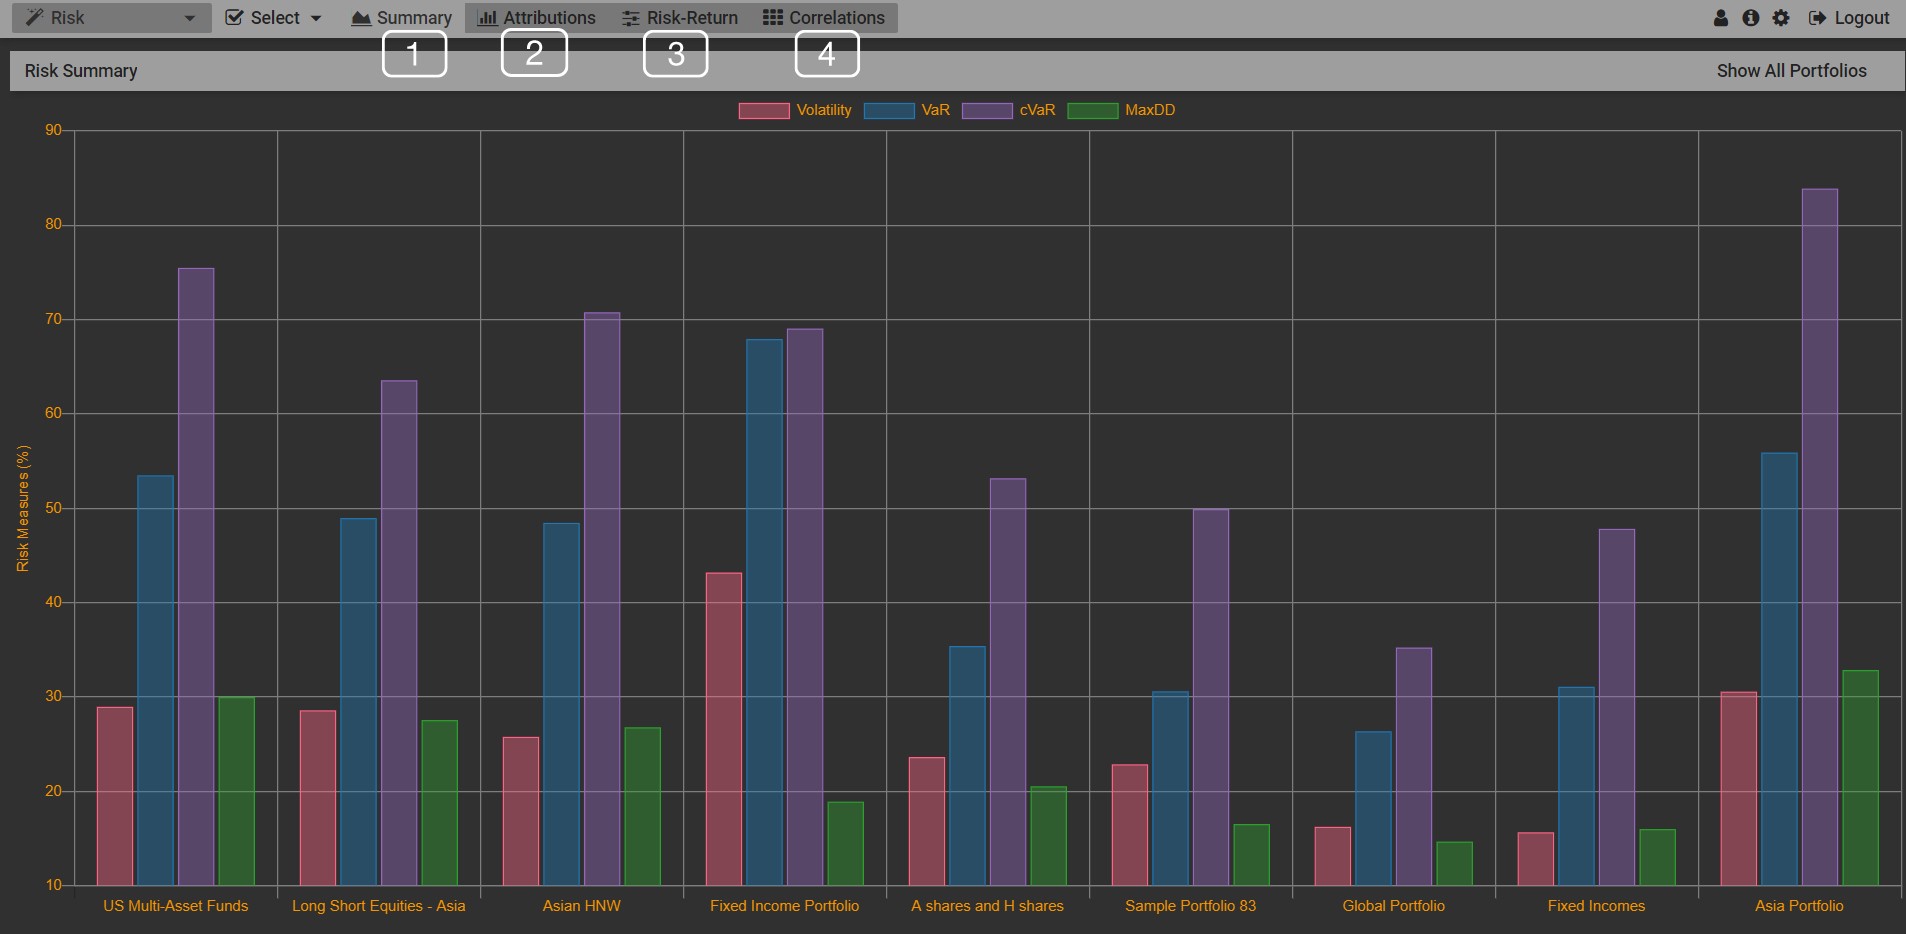
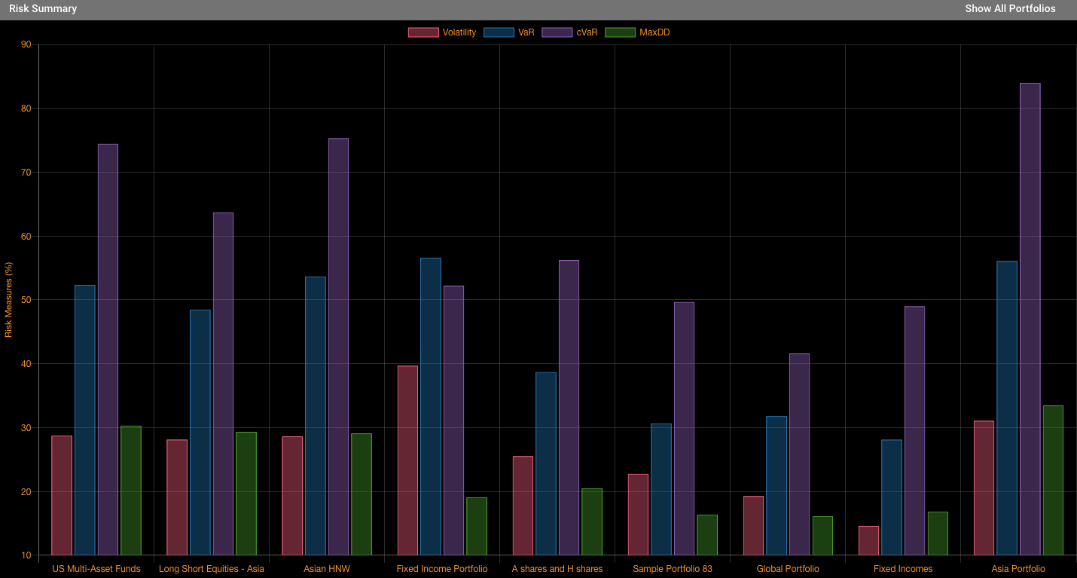
Risk Summary
You can review the risk measure (%) chart
in this platform.
Every portfolio has four bars which
represent following information:
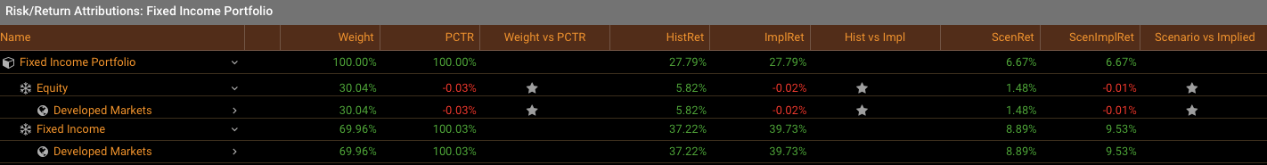
Risk/ Return Attribution
You can view the risk/return attribution
of every equity as Investor Porter.
This tab offers following information:
Risk-Return
This tab plots the comparison between your
selected portfolio and the efficiency frontier.
You can change and select
different portfolio/model portfolio to conduct the comparison with the
efficiency frontier in the group of the Expected Return (%) vs Volatility.
Correlation
Click Correlation and view correlation
between assets in your selected portfolio.